Brüel Acoustics
Renaissance of SWT
Dr. techn. Per V. Brüel
Today we have to develop and construct new acoustical absorbers without using mineral fibres as many people do not want this material used. We also need special absorbers which can stand high temperatures, heavy rain, and rough handling for sound damping in all kinds of machinery, airplane engines, cars, buses, railway cars, cold storage, operating theatres, etc. Testing of all the new absorbing material would normally be done in a certified laboratory where a standardised reverberation room is used in accordance with ISO standard 354. The standard requires a sample of around 10 m2 placed on the floor. To test absorption material in a reverberation room in this way is somewhat doubtful, because it is not the physical constant, the absorption coefficient " which is tested, but the acoustical effect of the material placed in that particular room at a particular place. The result of the measurements depends on the size and form of the area of the test sample. The measurement also depends on the degree of diffusion of the sound waves in the room. The shape of the test room also has an important influence. The ISO standard therefore requires a specific size and form of the room. The room should have either non-parallel walls or large sound diffusers. The result is also influenced by the location in the room of the loudspeakers and microphones. It is recommended that the loudspeakers are placed in a corner, and that the microphones are moved or rotated during the measurement. As it is the acoustical effect of the material in the room which is measured, it is not surprising that a very effective absorbing material can show more than 100% absorption. This is natural as the material absorbs some energy from the hard walls close to the edge of the material. It is common to find 120- 140% absorption at some frequencies.
The new edition of the ISO standard 354 requires that if more than 100% absorption is measured, the result should be recorded in the report as 100%. This has been decided because people cannot understand that it is possible to absorb more energy than that impinging the surface. Ordinary people do not believe in perpetuum mobile. It is in fact incorrect to call what is measured in a reverberation room: absorption coefficient. Absorption coefficient is the physical ratio related to the material and defined as:
a
= (absorbed energy) / (energy impinging the surface)In accordance with this definition, the absorption coefficient can never exceed 100%. On the other hand, a measurement in a reverberation room cannot measure the absorption according to the above correct definition as there is no real control of either the energy absorbed or the impinged energy. The energy is estimated from Sabine's or Eyring's statistical formulas. As the reverberation room technique will always give results with an uncertainty of at best ± 10%, it is not practical to use it for the development of new absorbers.
Small improvements of a few percent are often very common at the many stages in the process of such development. Another disadvantage is that the reverberation process needs a large area of the sample material, which is both expensive and time consuming to make.
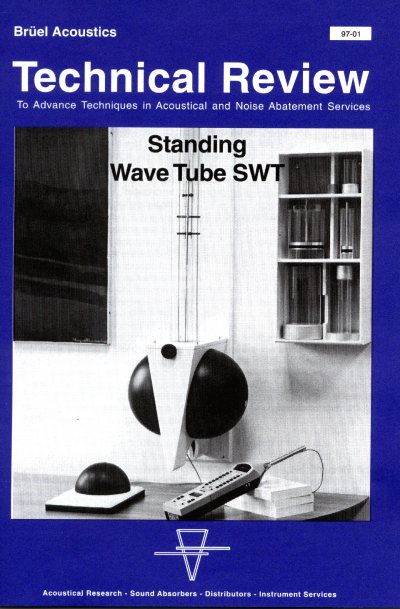
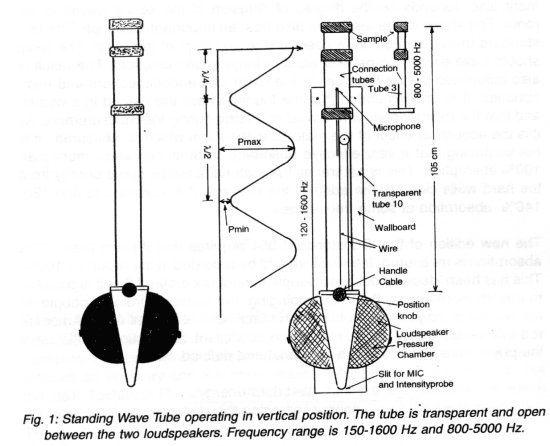
The right answer is to use the Standing Wave Tube (SWT), Fig. 1 shows a new convenient instrument which is used in the vertical position. A description of this instrument, type 40 BA, is given in BA Technical Information.
The SWT will always measure a physically correct absorption coefficient a0 for sound incident perpendicular to the surface of the sample. a0 is only dependent on the absorption material and not on other things such as the absorption measured in a reverberation room.
There are, however, some limitations, difficulties and psychological barriers to take care of.
Limitations:
the SWT can only be used when the tube diameter D is less than given by the formula:1,71 D = l
where l is the wavelength. But in practice a reliable measurement can only be made up to 20% from the lowest cross resonance. Fig. 2 shows some practical configurations for both circular and quadratic cross-sections.
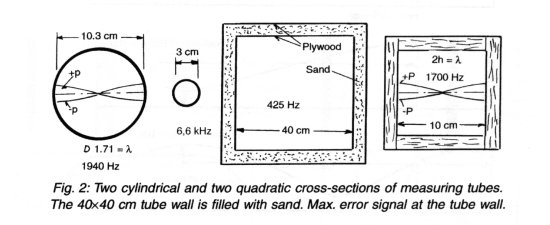
When a sound wave is travelling along a tube, it should maintain its amplitude. That is to say, no damping from the tube walls can be tolerated. With circular tubes there is no problem as all forces produced by the sound pressure are working tangential to the wall surface. As a consequence, the wall in a circular tube can be made of thin material and even transparent material. A quadratic or rectangular tube must be very stiff and strong to avoid energy absorption due to vibration. For a 10 cm quadratic tube, 20 mm glass or steel is normally sufficient. If vibration can be prevented, a thinner material can be used. For a 40x40 cm tube we have used a sand filling between two layers of glossy lacquered 6 mm plywood (see Fig. 2).
It is important that the microphone is placed in the middle of the tube as even two octaves below the cross resonance a pressure difference can occur over the tube cross-section. In Fig. 2 this is indicated for both a circular and a quadratic tube. It is also seen that if the microphone is placed in the centre, then a slight beginning of a cross resonance can be tolerated. But if the microphone is placed on the wall, it can be a disaster.
The length of the tube should be such that the ratio pmax/pmin, can be measured with reasonable accuracy. This gives the limit for the lowest frequency which can be measured in a SWT. Fig. 3 shows the low frequency situation where the first part of the tube, close to the speaker, is not useful. At point C the sound wave is plane and the section of the tube after C is normally all right. At the other end of the tube, at points A-B, two things can happen:
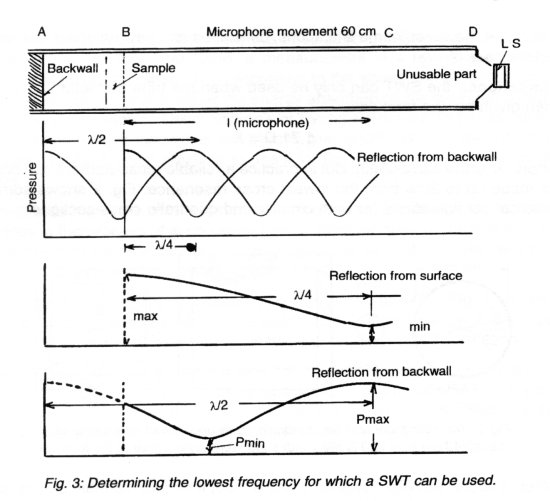
either the absorbing material B is very open and the sound passes through to point A before being reflected back. Or the material can be rather hard and the reflection takes place at B. In the latter case, the total measuring length B-C = l , can correspond to only l /4 as it is possible to measure maximum pressure at B and Pmin at C. If the reflection takes place at A, the measurable length l , has to include the second maximum, so A-C has to be more than l /2. For the SWT shown in Fig. 1, the movable length of the microphone is 60 cm which for the hard absorbing material, where the maximum pressure is at the sample and the minimum is l /4 60 cm away, corresponds to 142 Hz. If the material is soft, the lowest frequency is determined by A-C = l /2 corresponding to 250 Hz. But when the wavelength is long and the thickness of the sample is small (less than 8 cm), it is still possible to use the pressure at the sample as max. p and then it is possible to measure down to l /4 = 60+8 = 68 cm corresponding to 130 Hz. When the absorbing material is textile or a perforated plate with mineral-wool behind, the absorber is stiffness-controlled at lower frequencies. In this case the absorption will decrease by 6 dB/octave, and the absorption can be estimated with a good approximation down to a very low frequency (see Fig. 4).
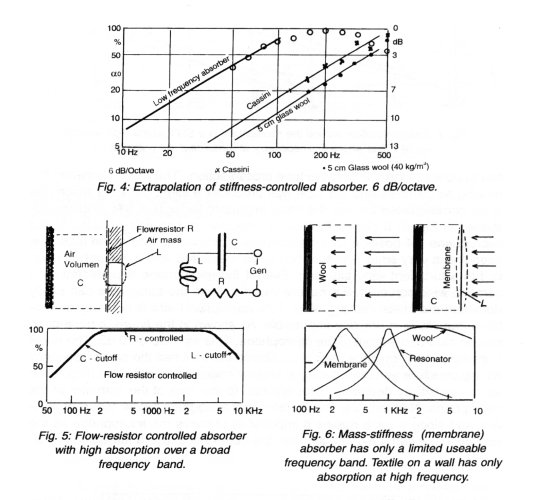
Absorbers of the membrane type, where the absorption is due to vibration in a plate or membrane, cannot be measured in a SWT. In any case, membrane-type absorbers have only limited applications as it can be proven that they cover only a narrow frequency band. Practically all effective absorbers are constructed as shown in Fig. 5. To obtain a broad frequency band, the flow-resistor (R) must have values of the same order of magnitude as the internal resistance of the generator. L must be small, which means a thin plate with small holes placed closely together. C should be large and this means the airspace behind the absorber also has to be large. It can been seen in Fig. 6 that a mass- stiffness controlled absorber can work only in a limited frequency band around a resonance. The best absorber is resistor controlled where the flow resistor make the impedance of air. So the most practical and efficient absorbers can be developed and tested in a SWT, thereby avoiding expensive and doubtful reverberation room tests.
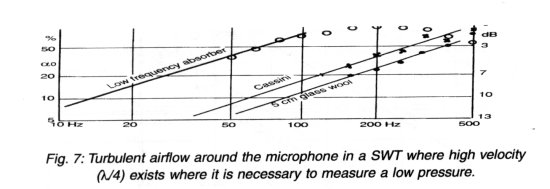
There are, however, still limitations to the lowest absorption which can be measured. Any material with less than 10% absorption has to be treated carefully, and material with an absorption coefficient less than 5% is impossible to measure. Not only is a very good seal between the sample and tube required, but also the cross-section at the microphone and transport system has to be less than 1-2 % of the tube cross-section. The friction between the moving air particles and the tube wall produces a slight damping which has to be compensated for. But the most important factor is a S/N problem illustrated in Fig. 7. It shows the sound pressure and particle velocity. At the microphone l /4 position for an absorption of 4% at the end of the tube, it is seen that a very small pressure has to be measured with a microphone placed in a turbulent wind situation. Even if the microphone is protected by a ceramic wind-screen, the pressure variation from the turbulence can easily dominate the measured pmin. With 10% absorption there is normally no problem, but 2% is in practice impossible. As shown in the figure, a nose-cone can be mounted in front of the microphone. This will help 8-10 dB. The noise from the wind turbulence cannot be filtered out as it has the same frequency as the pressure variation. Using a smaller microphone does not help much as the sensitivity decreases proportional to the area of the diameter of the microphone. Normally it is very seldom that absorption below 10% if of interest and since a cone makes it impossible to move the microphone all the way up to the surface of the sample, it is better not to use a turbulence cone.
Angle of Incidence:
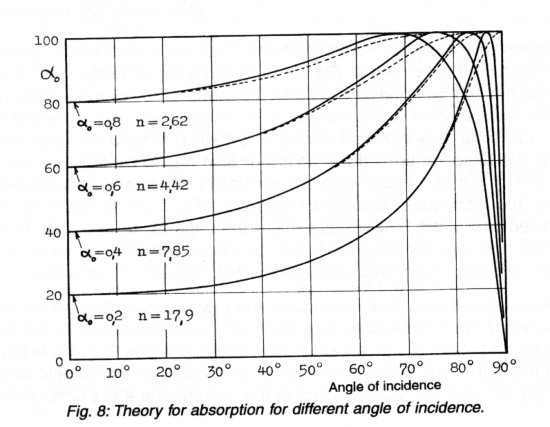
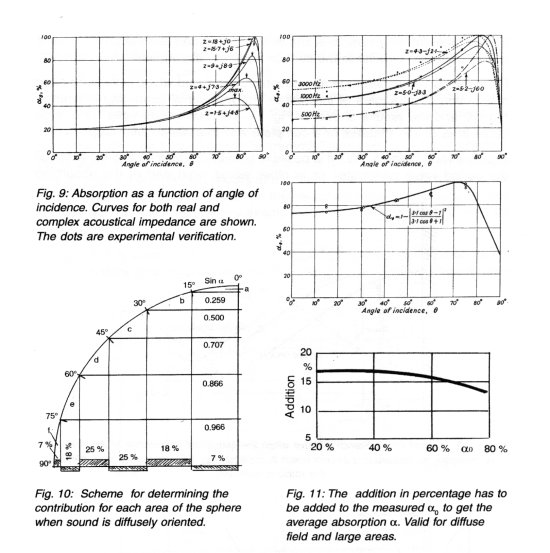
In a SWT it is only possible to measure the absorption of the sample for perpendicular incidence with great precision. The results are only dependent on the sample. It is a real physical characteristic of the material, without any influence due to the size and form of the room or the placing of the material in the room. For other sound incidence you normally get a higher absorption than u for any other angle of incidence. In 1938 there were several theories explaining this increase in absorption. In a later BA Review we shall describe and show the background and verification of these theories. The practical results are shown in Fig. 8, and are valid for absorbers which are resistive controlled such as porous material, and porous material covered with a hard plate with holes. In other words, the acoustical impedance at the reflecting plane should be real. If the impedance in this plane is complex with an appreciable imaginary component, the curves are slightly different. An example is shown in Fig. 9. It can been seen that sound waves travelling parallel to the surface have an "absorption" which is a0/2.From the curves an average absorption can be found which is valid for even distribution of all angles of incidence. The method of averaging is seen in Fig. 10 and the results shown in Fig. 11. The curves are valid for a large plane area of the material or a complete wall in a rectangular room.
Penetration: Using a SWT it is possible to evaluate how far into the material the sound wave penetrates or in other words what part of the absorbing material is active in the mechanism of sound absorption. In this way it can be determined where the efficiency of an absorber reaches its maximum and unnecessary material can be omitted.
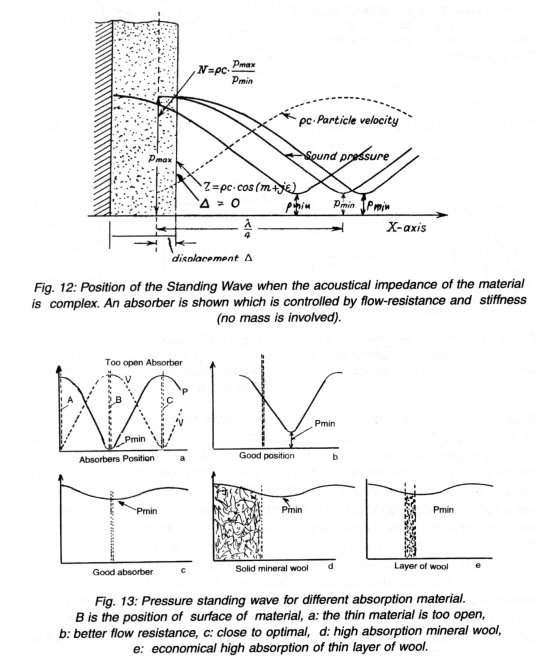
The technique is simple, see Fig. 12, where the distance from the sound pressure minimum to the surface of the sample is measured. Knowing the frequency, l /4 can be calculated and it can be determined where the position of the reflection in the sample "apparently" takes place. If the reflection takes place at the surface, then the material is too hard and does not absorb any energy. If the reflection occurs at the "back wall", then the material is too soft or open. The optimum is when the reflection takes place between the surface and the back wall. A few examples in Fig. 13 show both p and the penetration.
In Fig. 14 it is seen that the hard rockwool does not absorb as much as the only 5 cm thick glasswool for frequencies over 600 Hz; for lower frequencies it is the other way round. The AcoustiCassini, which is a thin 0.3 mm resistor behind an Al-net, has a resonance around 500 Hz where the absorption is high. When both mass and stiffness are involved, the "reflection" can occur both behind the back wall and outside the surface of the sample. To facilitate the position of the microphone, it is necessary to have a fairly accurate and simple way to check the distance between the microphone and the surface of the sample. It is convenient to use only the standardised preferred frequencies, where the wavelength or l /4 for every frequency can be taken from a table.
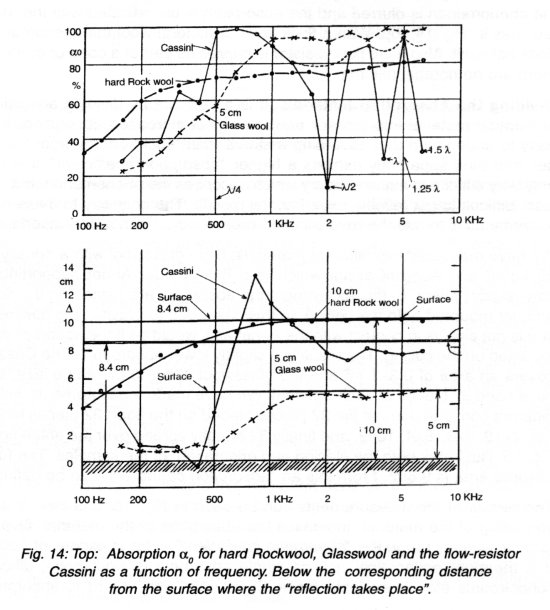
In Fig. 14 some pronounced minima in absorption for the Cassini are seen. The lack of absorption occur at l /2, l, and 1.5l . These minima occur when the flow-resistor is very thin and placed in a pressure maximum, where the particle velocity is small. When the velocity is nearly 0, no energy can be absorbed. This phenomenon only happens when the flow-resistor is perpendicular to the particle velocity direction. When the angle is different from 0° the phenomenon is blurred and the absorption is as indicated with the dotted lines in Fig. 14, top. With a thick layer of mineral-wool the phenomenon does not exist. Also if the flow-resistor is curved as part of a cone or cylinder, there are no notable minima.
Dividing the Absorption Material: It is a fact that by dividing acoustical absorption material into smaller parts one gets increased absorption. It is easy to understand that absorbing material can "suck" energy from the sides and thus apparently exhibits a higher "absorption coefficient". It is not only very difficult to make a theory which describes the phenomenon, but it is also difficult to get reliable experimental results. The only way to rnake measurements is to use the reverberation room method with all its uncertainty.
We have measured two different materials: 5 cm glasswool with a density of 60 kg/m3 and AcoustiCassini which is a half-cylinder Al-net supporting a flow-resistor sheet. In this experiment the absorbers are placed on the floor and not mounted onto the ceiling. In this case, due to gravity, the flow-resistor is not always in contact with the AI-net as it would be if the absorber was mounted on the ceiling. The result is a slightly lower absorption. The Cassini covers an area of 0.3x1 m2 and the glasswool is cut to the same size. We have used 32 pieces of each material. We have made measurements with 6 different configurations of the 32 pieces placed on the floor: 32 pieces together, 2x16, 4x8, 8x4, 16x2, and finally 32 equally spread over the entire floor. Fig. 15 illustrates both the placing and orientation of the samples. The total covered area is 9.6m2. From this an "absorption coefficient" can be defined.
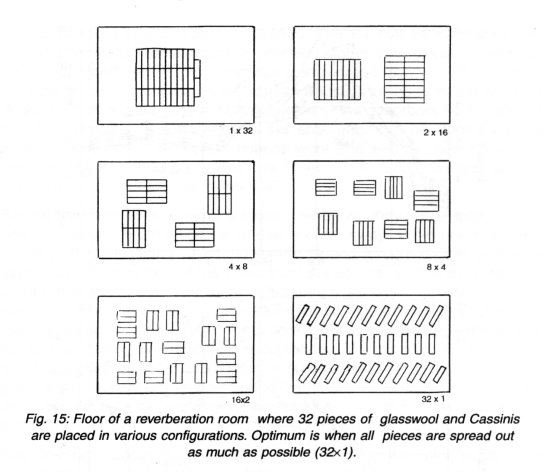
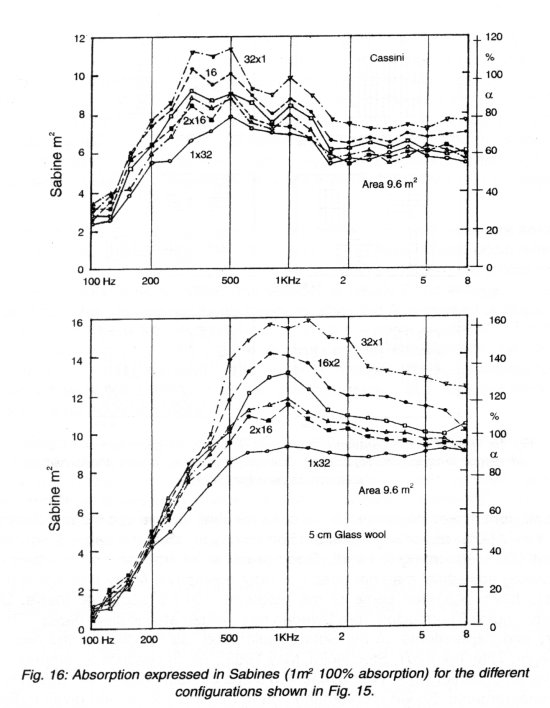
The results of the measurements can be seen in Fig. 16. It is clear that a spreading of the material increases the absorption of the material. Over a large frequency range the "absorption coefficient" is far in excess of 100%. It is therefore economical to use single absorbers in workshops, offices, schoolrooms etc. To evaluate these single units with regard to absorption coefficient makes no sense. In this case we shall always use the unit Sabine = 1 m2 100% absorbing surface. (Sometimes in USA the sab = 1 square- foot 100% absorbing is used). Good practical information on the effect of dividing acoustical material does not exist nowadays. Many theoretical papers have explained some of the problems. In his doctorate thesis, Dr. Sven-Ingvar Thomasson from Sweden has written an excellent paper "Theory and Experiments on the Sound Absorption as Function of the Area", ( Report Trita-Tak-8201, Stockholrn, May 1982), which contains a comprehensive list of earlier work. We have tested some of the theories, but none fit our measurements. So we recommend you to use the information given in Fig. 16. One must bear in mind that the results are dependent on both the actual acoustical impedance, room size, location in room, sound distribution, and the actual form and area of the absorber. Which part of the reverberation curve is used for determination of the reverberation time (RT) also has great influence. The ISO standard requires the use of the part of the reverberation curve from -5dB to -35 dB and this has been done for the measurements in Fig. 16. In general we prefer the early decay (EDT) which is most important for both speech intelligibility and music.
The curves given in Fig. 16 are from a major research project concerning material division made in collaboration with Florence University and financed by the EU under the M.O.N.I.C.A. project.
Practical Determination of RT in Rooms: We now have everything we need to estimate the reverberation time for every single frequency in auditoria, theatres, concert halls, studios, schoolrooms, offices, and sports- halls. We have measured a0 and from the drawing of the room in question the first reflection of the direct sound is determined for angle of incidence. From Fig. 8 and Fig. 9 the absorption coefficient a is found. Knowing the size of the absorber a correction of a can be estimated from Fig.16. Now simply multiply a with the surface area S of the absorber and we have the product aS. Adding it all together the total product SaS for all walls, ceiling, furniture and persons is obtained. The RT can be estimated from Sabine's formula. The accuracy is normally higher than using the average absorption coefficient a measured in a standardised reverberation room. If a detailed calculation shows that certain frequency ranges do not have the desired RT, it is often easy to change some of the absorbers so that the RT can be corrected. The changes in the absorbers can be done by using another perforation, a different mineral-wool and another flow-resistor or using a different airspace behind the flow-resistor. Each change can be checked on a small sample in the SWT.
Sound Barriers: Good sound screens - whatever they are - along motorways, railway lines, in offices or banks, should always have absorbing elements on the side facing the sound source. Sound screens cannot give more than a few dB reduction of the noise from the source, so it is extremely important that the screens are both sufficiently high, have the best form and absorb as much as possible of the sound at the right frequencies. Therefore start by making an A-weighted spectrogram not at the source of the sound, but at the place where people are disturbed. Then construct an absorber with the highest possible absorption at the frequencies where the spectrogram shows maximum levels. Sound barriers for outdoor use should be made of weather-proof material. Under these conditions it is still more important to use the SWT instrumentation for optimum performance.
Ray Tracing: Computer models of concert halls, sports-halls, auditoriums and theatres are today made by tracking sound rays around in the room. Each ray may reflect from walls and obstacles several times and each time some sound energy is lost due to absorption and sound spreading. Often the absorption coefficient for wall material is determined as an average figure from a reverberation room test. As the rays impinge at many different angles of incidence, it would be far more accurate to use u, with corrections as shown in Fig. 8. Correction for the size of the material should be made according to Fig. 16. In this way, a ray tracing program can be made correctly.
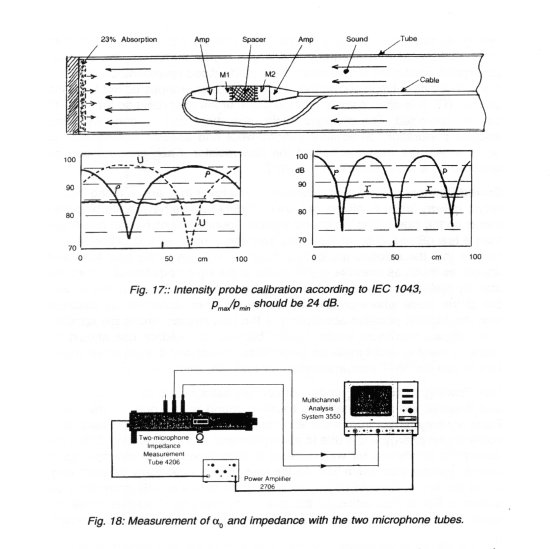
Sound Intensity Probe Calibration: Intensity measuring systems must be tested and calibrated in a SWT according to IEC standard 1043 from 1996. The probe must be moved inside a SWT which is terminated with an absorber with 22,3% absorption. This gives a pressure ratio from pmin to pmax of 24 dB. In this reverberant field the intensity meter must give a constant value within ± 0.5 dB for all probe positions. You can now check any opening behind the microphone membranes, any holes in a membrane and if the multiplier in the electronics does not calculate correctly. Fig. 17 shows the set-up which all laboratories working with intensity should be able to perform.
Two Microphone Test:
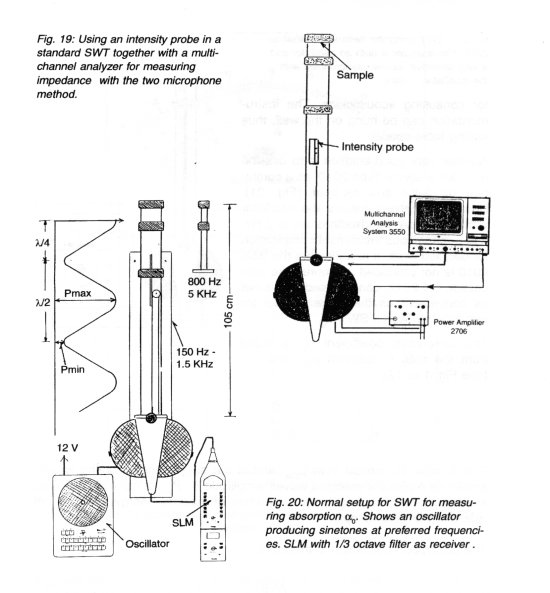
Some people prefer to test absorption material with broad-band noise. This is done using two microphones. See Fig. 18. This method is very fast to work with, but has some disadvantages. The microphone has a fixed location and for some frequencies, where the pressure is near 0, it is difficult to get reasonable results. A problem is also that an error signal always has a maximum at the tube wall, see Fig. 2.The standard SWT as shown in Fig. 1 also has the possibility, besides calibration of intensity probes, to be used as the basis for a two microphone system (Fig. 19). An intensity probe simply replaces the two wall-mounted microphones.
By placing an intensity probe in the middle of the tube, it is possible to use the Two Microphone System over a larger frequency range. If the probe can be moved, it is possible to check the system only by moving the probe. Therefore the third microphone position shown in Fig. 18 is not necessary.
Oscillator and Receiver:
A SWT can be driven by any oscillator which can produce 0.5 W pure tone. The signal should be fairly clean, with better than 0.5% distortion. In particular, the second harmonic is very disturbing as it occurs where the pressure minimum is located. For absorption measurements it is an advantage to use an oscillator with fixed preferred frequencies according to IEC standard R 266. It is then easy to find A and the "apparent" reflection point. A sound level meter, SLM, with 1/3-octave filter can be used as a receiver. The set-up can be seen in Fig. 20. This is a very simple instrumentation set-up which can manage practically all measurement problems for consulting acousticians. The instrumentation can be hung on the wall, thus saving table-space.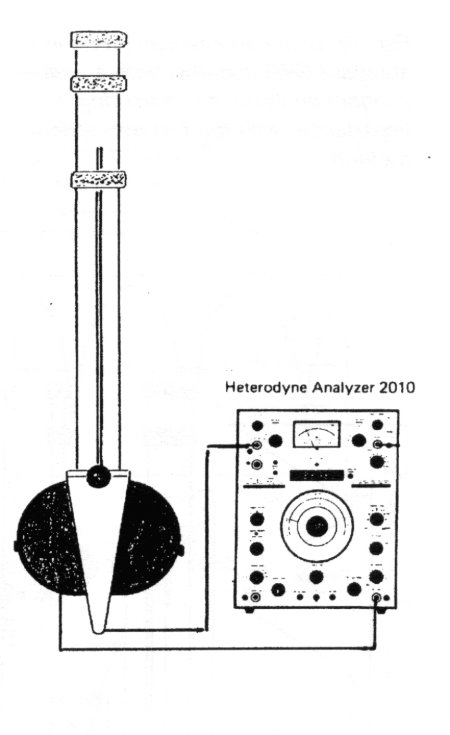
Fig.21: SWT using the heterodyne Analyser 2010. The analyser is both an oscillator and a very selective receiver synchronised with the oscillator
Another very good solution is to use the old B&K analyser Type 2010 as a combined oscillator and receiver (Fig. 21). Here the analyser follows the oscillator with a selective bandwidth down to 3 Hz. It is a marvellous instrument combination for detailed work. It is a pity that the B&K 2010 is not produced anymore. The successor, B&K 2012, can be used, but is not as convenient as the earlier model for use together with a SWT a0.
The absorption coefficient a0 is found from the ratio n between pmax and pmin (see Fig. 1 or 12).
![]()
This formula is derived from pmax and is the sum of the incoming waves' amplitude A plus the reflected waves' amplitude B. pmin is naturally A-B. The absorption coefficient a0, is the proportion of incident energy which is not reflected from the sample.
The absorption coefficient is therefore:
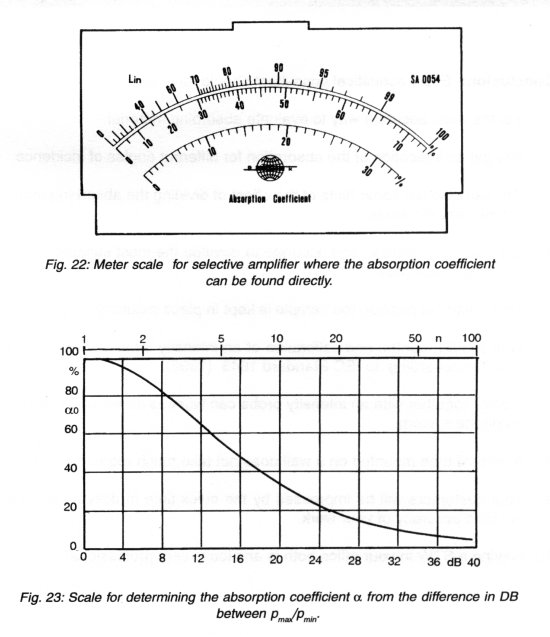
If the receiver is a SLM or an instrument with a dB scale, it can be used directly by using the curve given in Fig. 23. Take the difference in dB between pmax and pmin and find either a0 in % or the ratio n.
Conclusion: Every acoustical consultant should have and use a SWT.
It is the most accurate way to evaluate absorbing material.

Ó Brüel Acoustics - from Dr. Per V. Brüel & Dr. G. Mario Mattia, Rome, Italy, august 1998.
® Web masters Mario
& Paolo Mattia - updated on April 2003, Web Master
On line from 1995 November 10